To make sense from data around you makes sense. Expressing your findings with warm, familiar materials like wood, paper, wool, leather and glass can make to a form of art. And there is a vast amount of data around us, in fact we live in it. Laurie Frick is an artist who is driven to tell her story.
She collects the data herself with a variety of as she calls rigorous methods and with that come to hand-made patterned wall-arts. The physicality of her expressions leads in Frick’s conviction and philosophy to a better understanding what our bodies and behaviour tell us, make the vast amounts of numeric data from abstract to tangible, because people can understand the patterns intuitively. Colours play an important role.
The image above has been taken from lauriefrick.com. It is worth visiting, because it inspires, it is a beautiful bouquet of works and it gives you the opportunity to acquire one of these professionally hand-made unique masterpieces.

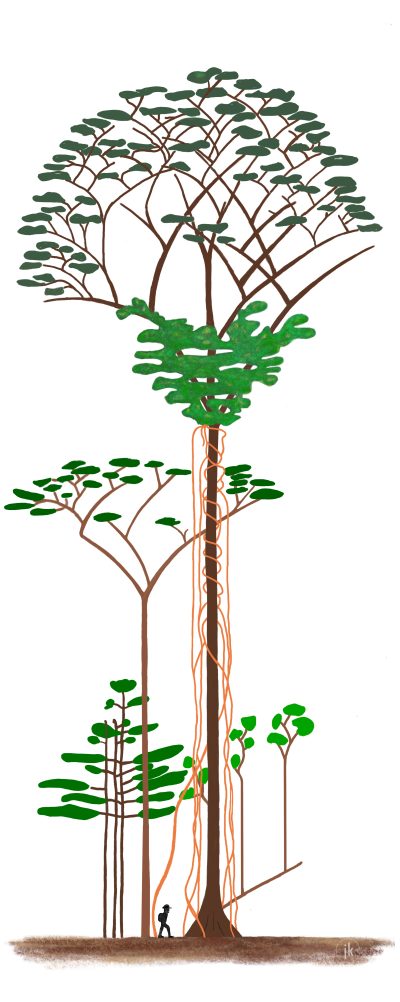 One of the core determinants in diagnosing an ecosystem is the interaction between components, in this case, plant species. Understanding how different roles in the forest ecosystem can interact is critical to proper diagnosis.